The 2015 Ibrahim Index of African Governance: key findings
08 October, 2015
The overarching message in the 2015 Ibrahim Index of African Governance (IIAG) is that when looking at the average of all countries, overall governance progress in Africa has stalled since 2011. However, Africa is made up of 54 countries, and there are varied results across the countries. Further, the IIAG is comprised of 93 indicators, which make up the 14 sub-categories of four categories. Each has their own score, for each country, across a 15 year time period (2000-2014 inclusive). We can, therefore, pull out some overarching findings, but it is important to note that underneath these there is a wealth of other data and information.
Why has overall governance progress on average stalled, and why are we looking at trends since 2011?
This year, the Foundation decided to base Index analysis on a four year trend, from 2011 to 2014 inclusive, to focus on the near term. Also, 2011 was a particularly interesting year for Africa given the secession of South Sudan from Sudan, and the spread of the Arab Spring.
As can be seen from the graph below, the African average score for overall governance improved year-on-year between 2000 and 2008. However, since then it has been stagnating:
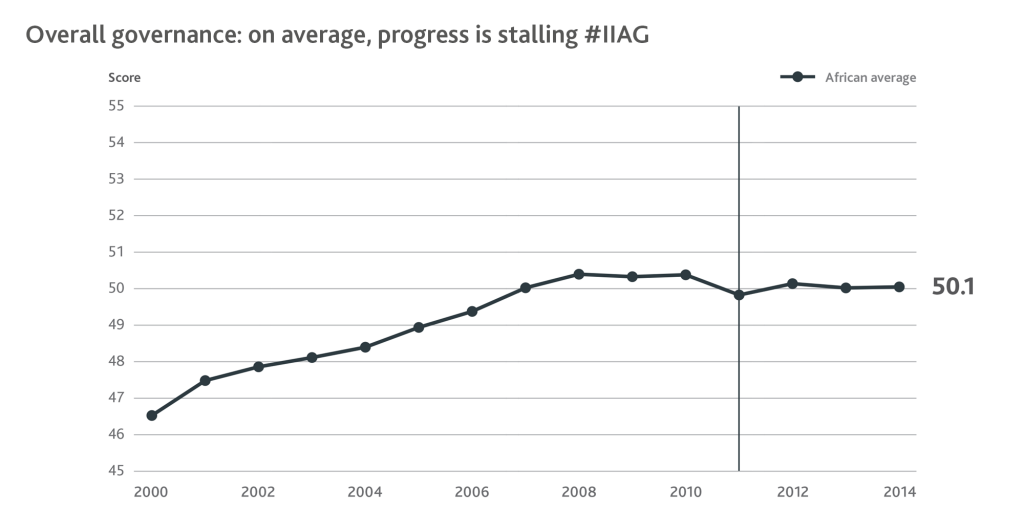
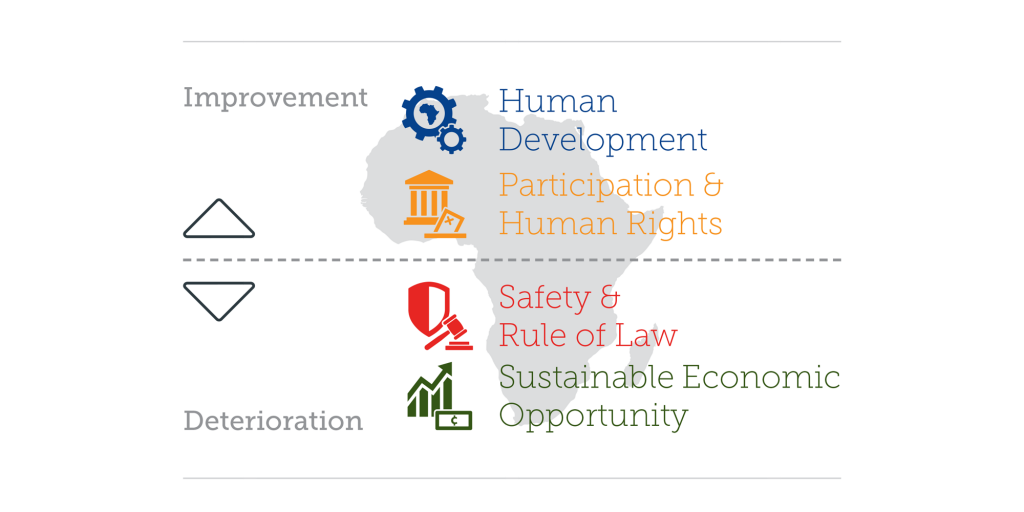
The ‘stalling governance’ trend is due to the inconsistency of progress in the categories and sub-categories of the IIAG, and their underlying indicators. These constituent components of the Index show mixed results. Progress has been made in two of the IIAG’s categories, Human Development and Participation & Human Rights, whilst the other two categories, Safety & Rule of Law and Sustainable Economic Opportunity, have shown decline:
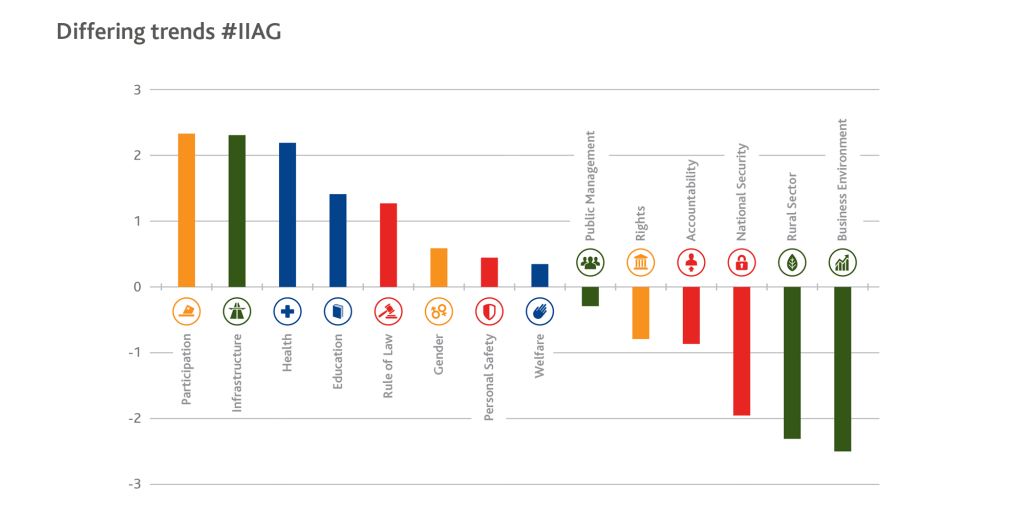
At the sub-category level, eight of the 14 sub-categories have registered average improvement, whilst six have declined:
What has been driving these category results, and thus the overall governance average score?
The IIAG is a composite index, meaning that it is made up of different measures of governance that are averaged to give an overall governance score. This means that we are able to dig deeper into the results to see what is driving the results at the category level.
Human Development: highest scoring category, and biggest improver
Human Development is the highest scoring category in the IIAG with an African average score of 56.4, and also the most improved score since 2011 (+1.2 points). Further, this is the only category in which all of the underlying sub-categories have improved over the last four years.
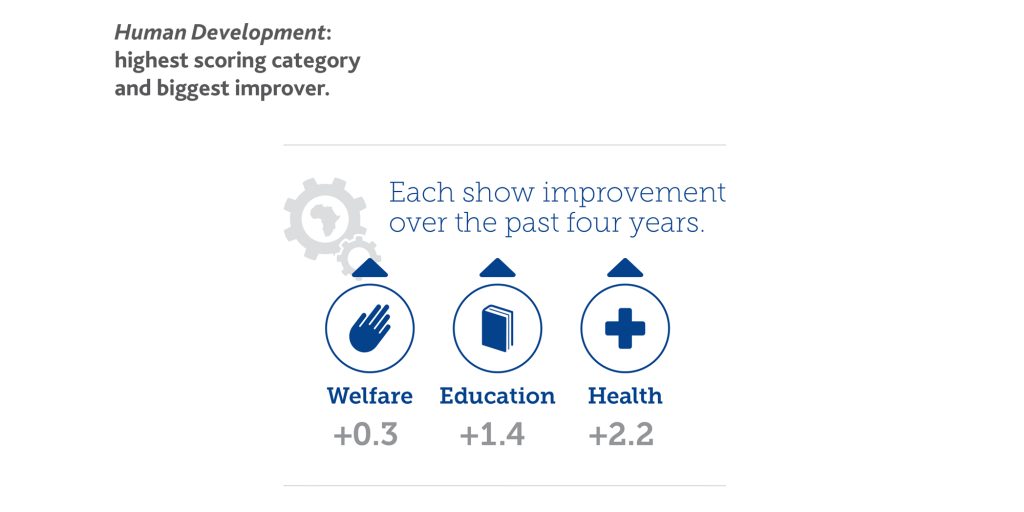
Thirty-nine of the 54 countries have shown some improvement in Human Development since 2011. The main reason behind this progress is the Health sub-category, which has improved by +2.2 points since 2011. Five of the top ten highest scoring indicators across the entire IIAG are in Health, which also contains the most improved indicator of all 93 indicators: Antiretroviral Treatment (ART) Provision (+13.4 points since 2011). This improvement is over double that of the second most improved indicator, Telephone and IT Infrastructure (+6.0). In fact, when looking at the country level, all but four countries have improved in this indicator since 2011.
Education has improved by +1.4 points since 2011, and six of the seven indicators that make up this sub-category have improved. It is noticeable, however, that the indicator Education System Quality has deteriorated and eight countries register a deterioration of over -10.0 points in this measure. This indicator specifically measures how well the educational system meets the needs of a competitive economy, so its decline may well be linked to unemployment on the continent.
Welfare exhibits the least improvement within Human Development, with mixed results in the underlying indicators.
Participation & Human Rights: overall improvement, but faltering results in Rights
An average improvement of +0.7 since 2011, to an average score of 49.3 in 2014, has been driven primarily by improvement in the Participation sub-category (+2.3). Gender has also improved (+0.6), although further improvement is being hindered by an average decline of -5.3 points in the indicator Legislation on Violence Against Women, the only de jure measure of the sub-category. The overarching progress in Participation & Human Rights should not mask, however, the fact that there has been deterioration in Rights.
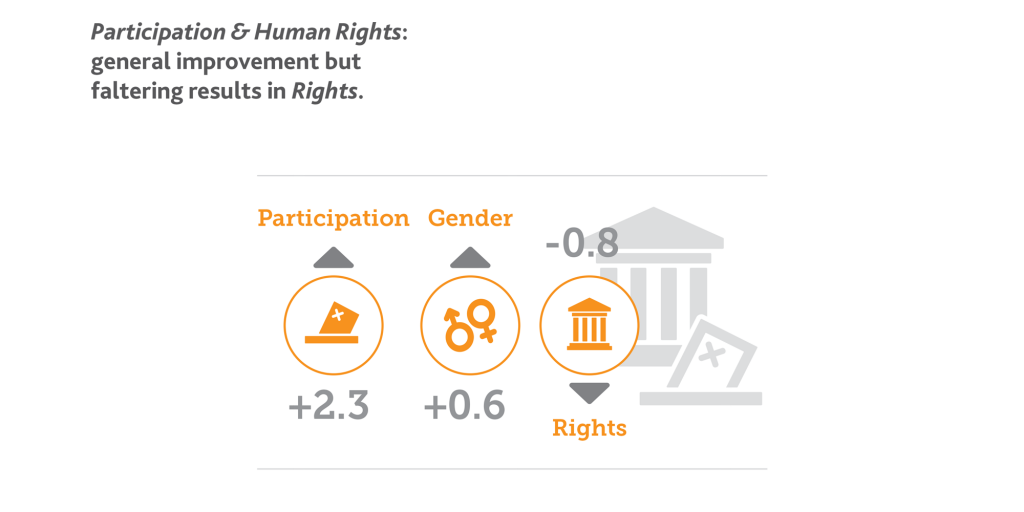
Thirty-one out of the 54 countries have deteriorated in the Rights sub-category since 2011, the indicator Freedom of Association & Assembly showing a noticeable average decline of -6.9 points in the last four years, the third largest indicator deterioration across the entire IIAG. Civil Liberties and Human Rights have also deteriorated.
Safety & Rule of Law: decline in second highest scoring category
The first of the two categories to have exhibited decline is Safety & Rule of Law, the second highest scoring category in the Index (51.3). The decline of -0.3 points over the last four years is driven by mixed results at the sub-category level: Rule of Law (+1.3) and Personal Safety (+0.4) show improvement, on average, while Accountability (-0.9) and National Security (-2.0) show deterioration. The drop in score in Accountability is notable as this is already the lowest scoring sub-category in the IIAG (35.5).
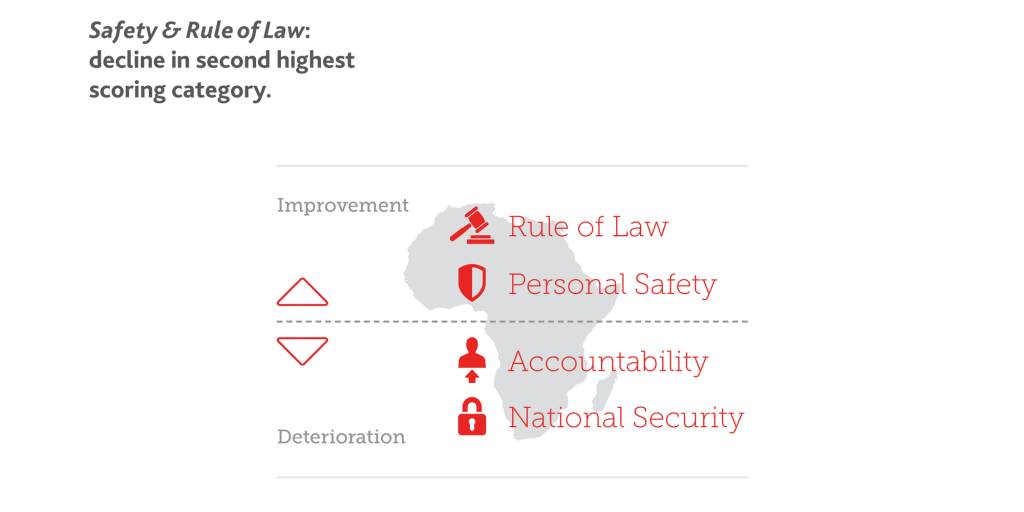
The improvements in Rule of Law and Personal Safety are largely driven by the indicators Transfers of Power (+4.9) and Police Services (+4.6) respectively. The most deteriorated indicator in the category, Government Involvement in Armed Conflict (-5.6), is the main reason behind the decline in National Security, whilst the slight drop in Accountability can be attributed to declines in the indicators Diversion of Public Funds (-2.1), Accountability of Public Officials (-2.0), and Corruption in Government & Public Officials (-1.8).
Sustainable Economic Opportunity: lowest category score and largest deterioration
This category has two characteristics that are notable: Sustainable Economic Opportunity is the lowest category score in the Index (43.2) and has shown the largest deterioration since 2011 (-0.7).
Three of the four underlying sub-categories, Public Management (-0.3), Business Environment (-2.5) and Rural Sector (-2.3), have deteriorated. Business Environment has shown the largest sub-category decline across the entire IIAG.
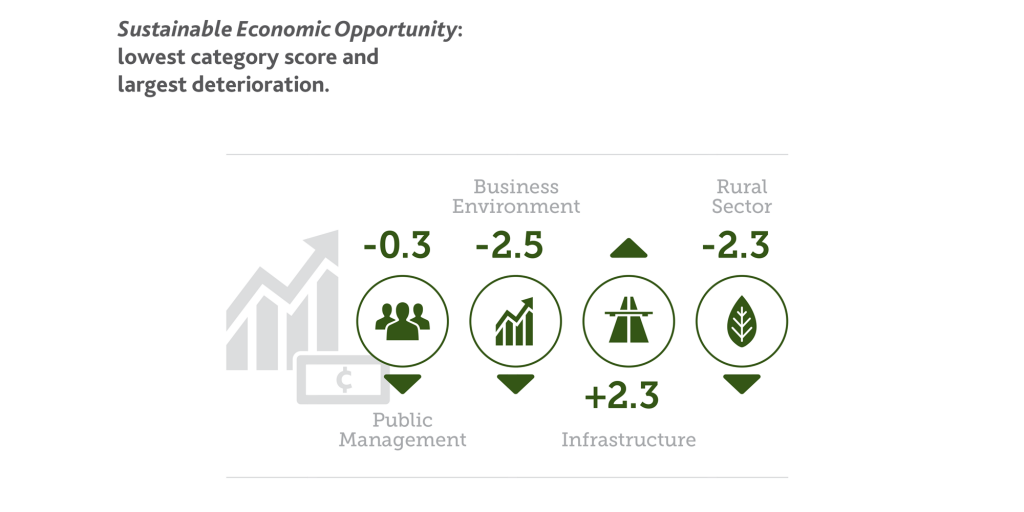
Business Environment has shown year-on-year deterioration since 2011, driven by the two most deteriorated indicators on the continent over the past four years: Soundness of Banks (-11.0) and Customs Procedures (-9.0).
Within Sustainable Economic Opportunity, improvement is observed in the Infrastructure sub-category only (+2.3). However, at the indicator level three of the seven Infrastructure indicators have declined since 2011, the most pronounced of which is Electricity Supply (-2.1).
Africa is not a country: what are the key findings at the country level?
There are mixed results; some success stories, some large deteriorations. Each of the 54 country’s results shed light on its unique situation, and users of the IIAG can explore each individually. The need to look at individual countries is supported by the fact that top ranked Mauritius scores 79.9 in 2014, over 70 points more than the continent’s weakest governance performer, Somalia, which achieved a score of 8.5. The remaining 52 countries show diverse results and differing trends. When it comes to category performance, only six countries improved in all four components: Côte d’Ivoire, Morocco, Rwanda, Senegal, Somalia and Zimbabwe.
Which countries do the best?
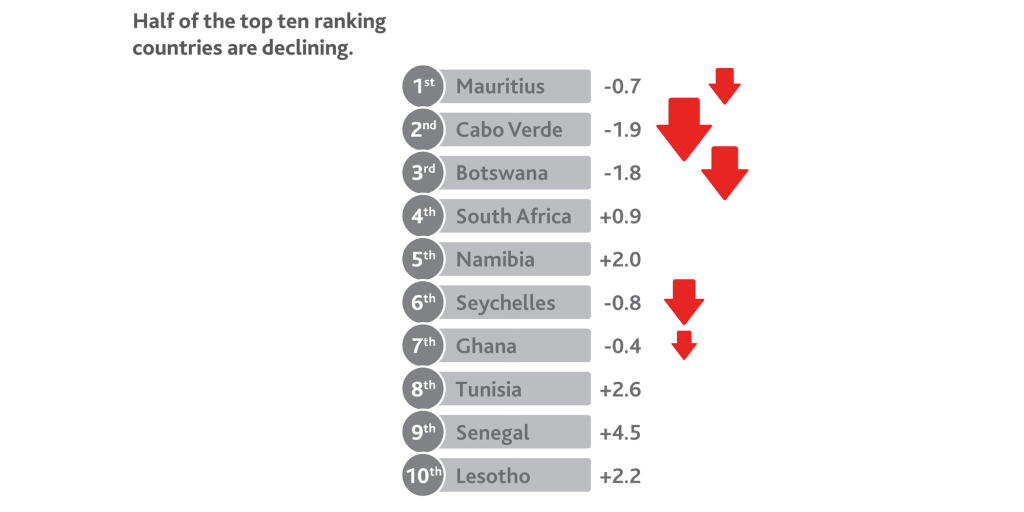
The top ten ranking countries in the 2015 IIAG are (in order): Mauritius, Cabo Verde, Botswana, South Africa, Namibia, Seychelles, Ghana, Tunisia, Senegal and Lesotho. Interestingly, five of these countries (Mauritius, Cabo Verde, Botswana, Seychelles and Ghana) have deteriorated since 2011. Further, the 2nd and 3rd ranked countries (Cabo Verde, Botswana) are also in the top ten most deteriorated countries in Africa since 2011.
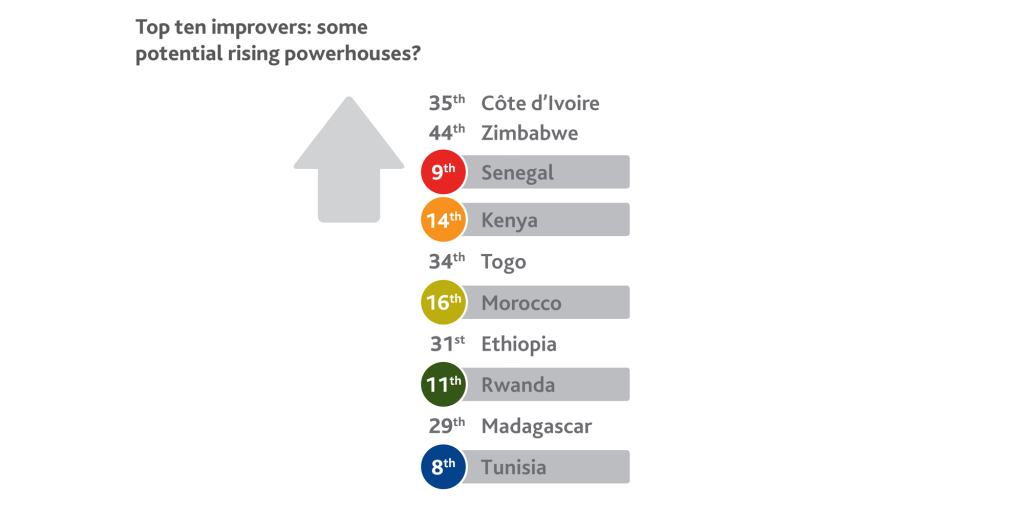
The IIAG also highlights some notable improvers over the last four years, with Côte d’Ivoire having shown the most progress. These top ten improvers represent almost a quarter of the continent’s population and within this group we perhaps see some potential future powerhouses. Whilst we are used to seeing the greatest governance gains in countries which are coming from a low base, such as post-conflict countries, over the past four years five of the top ten improvers are those that already rank in the top 20 of the Index. All five of these countries received their highest ever overall governance score in 2014.
What else?
The size of the data set means there are many other findings. There are the top and bottom ten in each category, sub-category and indicator. There are improvements and deteriorations in different measures, there are many different time trend combinations. How, for example, has your country done since the current President came to power? How has a certain indicator improved or deteriorated, since a certain policy was put in place in a country?
Using the IIAG
The IIAG can be used in a variety of ways. The best way to analyse the data and view the IIAG structure is by downloading the comprehensive Data Portal (also available online). For a synopsis of the results, read our Executive Summary. You can also read detailed overviews of each sub-category in our Sub-category Insights, or browse Country Insights for all 54 African countries, via our downloads page. For more information on how the IIAG is structured and its methodology, visit the technical section of the downloads page or see the methodology page.
Mo Ibrahim stated at the Foundation’s 2015 IIAG launch that "governance is measurable". The 2015 IIAG is a tool to do this, and the above are just highlights of the findings. The Foundation hopes that the IIAG is continued to be used to inform and sustain the governance debate.