The 2017 Ibrahim Index of African Governance (IIAG) is the 11th iteration of this Index. The IIAG is an annual statistical assessment of the quality of governance in every one of the 54 African countries, covering a 17-year time series from 2000-2016 inclusive.
As the Founder of the Mo Ibrahim Foundation (MIF), Dr Mo Ibrahim says:
The Index is like a dashboard showing countries how they are delivering the basket of goods and services to their citizens.
MIF defines governance as the provision of the political, social and economic public goods and services that every citizen has the right to expect from his or her state, and that a state has the responsibility to deliver to its citizens.
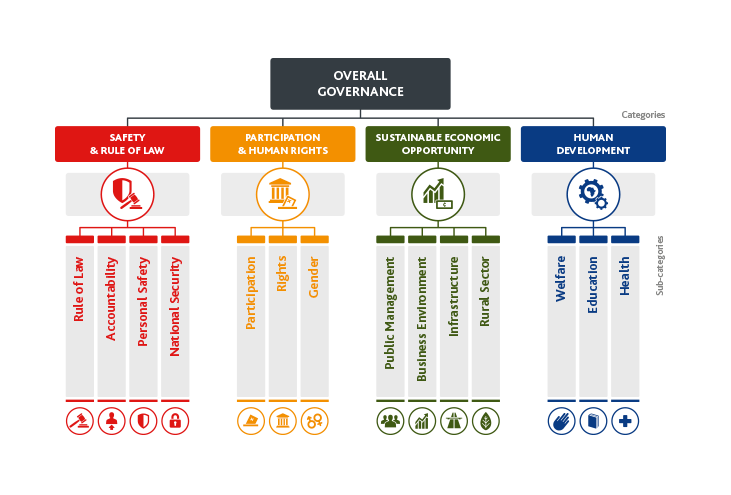
The 2017 IIAG framework has four overarching dimensions (categories) which reflect the Foundation’s definition of governance:
- Safety & Rule of Law
- Participation & Human Rights
- Sustainable Economic Opportunity, and
- Human Development.
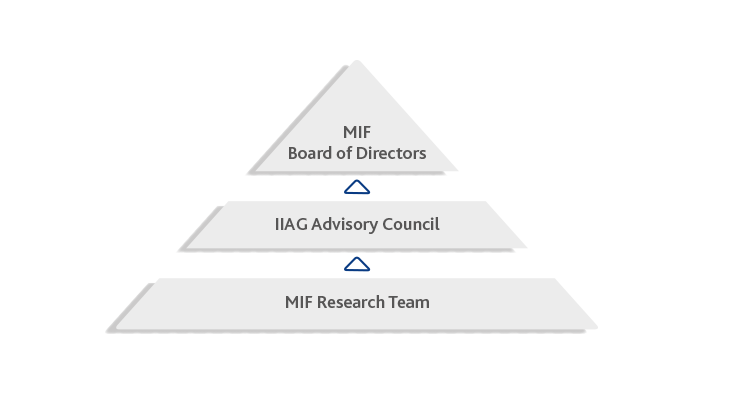
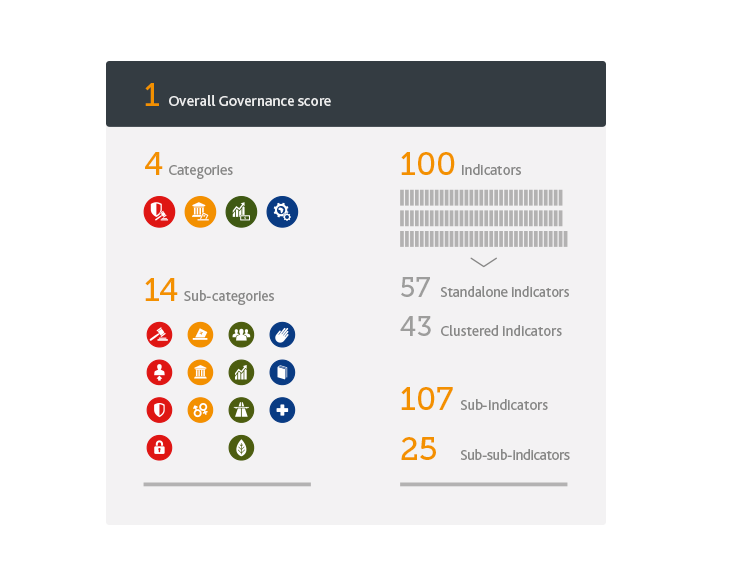
These categories provide a framework around which to organise underlying data and construct the IIAG, with 14 sub-categories made up of 100 indicators. Refinements to the framework are carried out by MIF’s research team in consultation with the Foundation’s Board and the IIAG Advisory Council.
Selecting variables
In order to measure the delivery of governance, we compile data from 36 independent international sources, such as United Nations agencies, the World Bank, Political Terror Scale and Armed Conflict Location & Events Data Project. 28% of the data in the 2017 IIAG comes from African sources, namely African Union Commission, Afrobarometer, CDD-Ghana, African Development Bank, Global Integrity, and United Nations Economic Commission for Africa.
Each year the IIAG is refined to take into account new data available, including historical data. The data included needs to meet certain criteria: it needs to be a proxy for governance which covers at least 33 of the 54 African countries and provides at least two years’ worth of data for these countries since 2000. The annual refinement of the IIAG means that with each iteration of the Index, the entire data set is updated from the first data year in the IIAG, 2000.
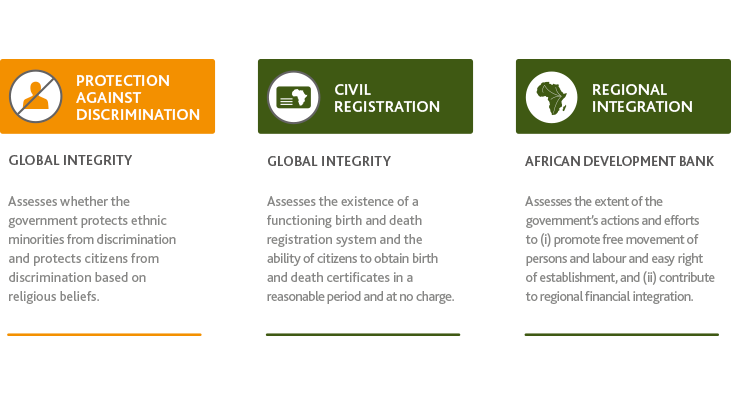
Altogether, the 2017 IIAG includes 177 variables collected from 36 data sources. This year, 16 new variables have been included, ten from a new data source – Varieties of Democracy (V-Dem). Besides the variables which strengthen already existing indicators, new concepts of governance not previously included in the IIAG have been added:
Processing the data
The 177 variables come in different units of measurements. For example, the number of individuals displaced by conflict; percentage of women in the cabinet; incidence of riots and protests in a country; perception of citizens of their government’s action. Some data are available from source as percentages, some are infinite numbers whilst others are in an ordinal scale.
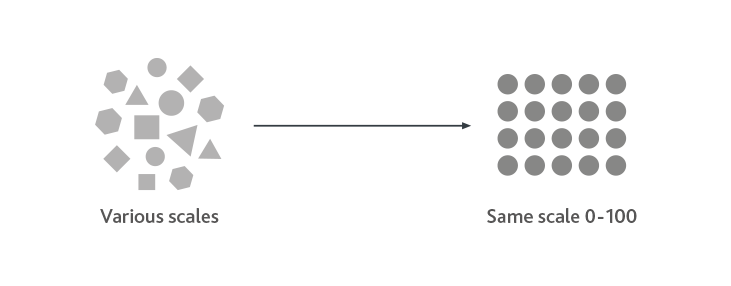
These units are standardised to make comparisons between variables and countries meaningful. The Foundation employs a statistical process called min-max normalisation whereby all raw data are transformed to a scale of 0.0-100.0 (where a score of 100.0 is the best score a country can achieve). Nevertheless, a score of 100.0 after normalisation does not imply that a country’s score, in raw data terms, is perfect.
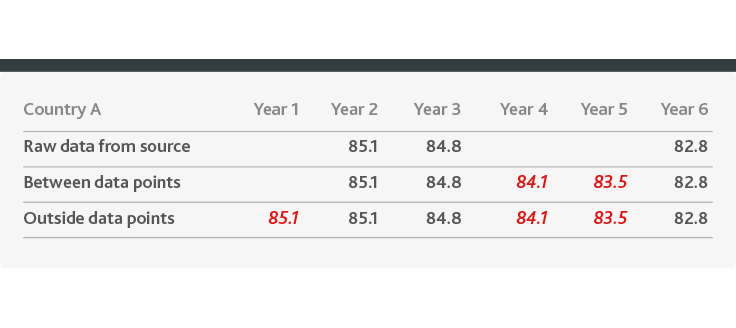
Over the 17-year time-series, there are missing data points. Estimates are provided for these missing data points using a statistical process called imputation whereby scores are dragged backwards, forwards or averaged in between data points.
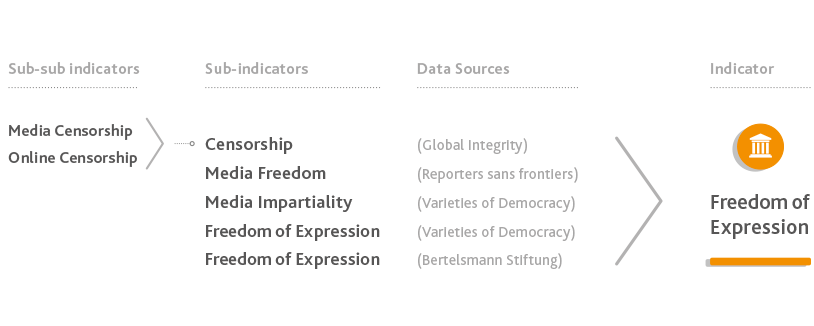
Where there are data from multiple sources measuring overlapping governance proxies, these are combined into a single clustered indicator. For instance, data measuring Electricity Infrastructure are averaged from the sub-indicators Electricity Supply (Expert Assessment data from the World Economic Forum) and Reliable Electricity Supply (Public Attitude Survey data from Afrobarometer). In other instances, variables measuring narrow concepts such as Media Censorship and Online Censorship are clustered together to create the Censorship sub-indicator. In turn broader concepts such as Censorship, Media Freedom, Media Impartiality and Freedom of Expression are clustered together to create the indicator Freedom of Expression.
2017 IIAG in numbers
In the 2017 IIAG there are over 200,000 data points where the Index has data for any given country in any given year for any given measure.
The 177 variables are normalised and clustered to create 100 indicators, which form 14 sub-categories that make up the four categories which are averaged to make up one Overall Governance score. This construction method amounts to a total of 251 measures of governance in the IIAG.