2020 Ibrahim Index of African Governance: a new online data portal
01 December, 2020
With the launch of a new IIAG dataset and fully revised framework, the Mo Ibrahim Foundation (MIF) has also made a complete redesign of its online data portal at iiag.online, the first since it was launched in 2016.
The data portal is a tool that allows all those interested in African governance to freely explore 281 measures of the Index, down to sub-indicator level, and compare and contrast across all 54 African countries as well as 18 regional and economic groupings. In addition, with the introduction of a new Citizens' Voices section, it is also possible to explore all 46 public perception measures, giving a total of 327 measures of governance to interrogate over a 10-year timeframe (2010-2019).
Exploring the data freely
The Foundation is committed to making data on the quality of governance in Africa freely available and accessible to all citizens of the continent and interested stakeholders. With this in mind, the data portal allows users to select any measure and explore the score, rank and trend for any location in four ways:
- Overview gives a snapshot of the selected data for the latest data year (2019)
- Graph allows the user to explore scores over time as a line graph, or to view annual Average Trends in a quadrant graph
- Table view presents the data selected as a regular, sortable table, with an option to view scores or ranks
- the Map presents a map of Africa with the selected locations highlighted, and allows a visual representation of how those measures are performing both in scores for a given year, or its trend classification.
Note that certain views have restrictions on the amount of measures or locations you can choose, and while the portal currently has a limit of comparing one to many, future plans include introducing multi-multi selections for each view. This unique ability to choose whichever measure is of interest and how to display the result puts the user firmly in control and allows for a greater and more flexible analysis of the data presented. However it can also be daunting at first, which is why MIF provides example views linked at the bottom of every page to give a snapshot of how the data can be used.
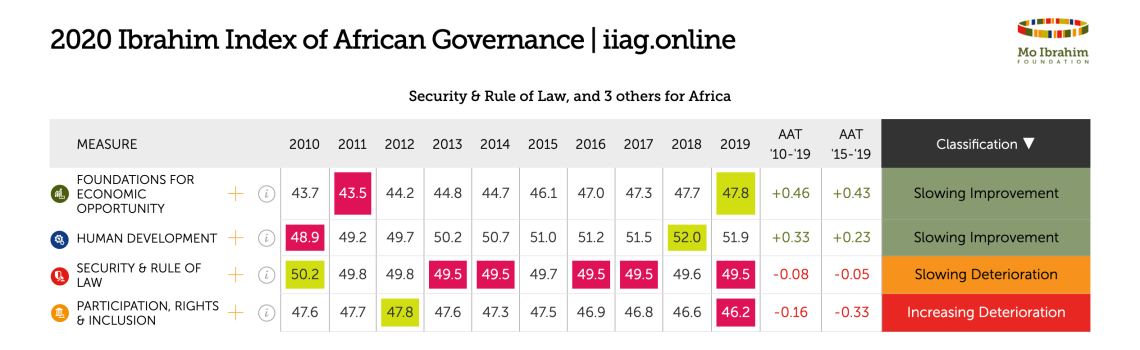
Example of a table on the data portal
New design and new features
Previous users of the data portal will be familiar with the four main views offered, with a brand new design. Aside from a fresh look, the site has also been revised to make the experience more intuitive and provide an easier way to access advanced features and functionality.
New additions to highlight include a new Scores map, new interactive functionality on the line graph and a section on every page highlighting MIF-curated views that will change regularly. The data portal will be continuously updated with new views, features and functionality throughout the 2-year lifecycle of the dataset, so keep checking back to see what's new.
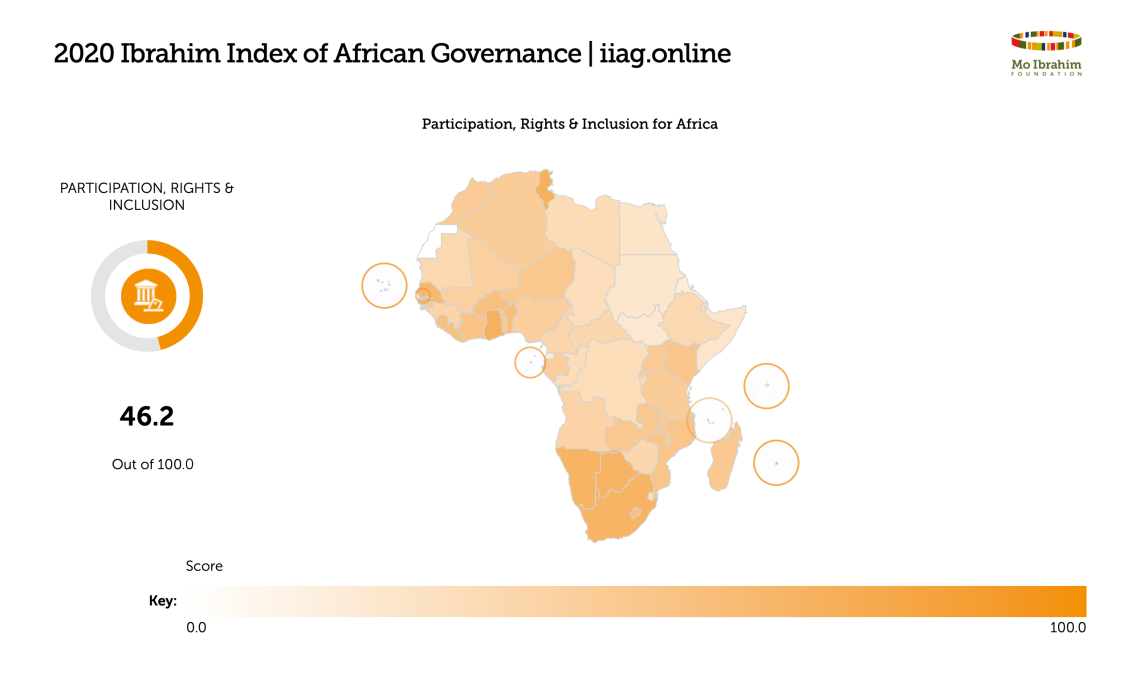
Example of the new Scores map
The IIAG remains the most comprehensive dataset on African governance, and this data portal continues to reflect that as the most comprehensive tool to explore all the data online. Compare, contrast, save and share your findings, we'd love to hear what you find via #IIAG.